Watershed Delineation & Analysis in ArcGIS Pro
Watershed delineation and analysis are critical components of terrain analysis, focusing on the identification and characterization of drainage areas in a landscape. This information is important for flood risk assessment, designing effective stormwater management systems, and protecting water quality.
Watershed delineation involves using DEMs to map out the topography, determining flow direction and accumulation, and defining the watershed boundaries. This process helps in predicting the impact of land use changes on hydrology, planning conservation efforts, and implementing effective watershed management practices.
In this article we will be using the Shuttle Radar Topography Mission's (SRTM) Digital Elevation Model (DEM) 1-arc Second Global. The dataset was downloaded via Earthexplorer (https://earthexplorer.usgs.gov/). This article will cover examples and steps for terrain analysis.
Terrain analysis is covered in a different article.
The SRTM payload flew aboard the Space Shuttle Endeavour during the STS-99 mission. SRTM collected topographic data over nearly 80% of Earth's land surfaces, creating the first-ever near-global dataset of land elevations.
The SRTM payload consisted of two radar antennas, one located in the shuttle's payload bay and the other installed on the end of a 200-foot mast that extended from the payload bay. Each SRTM radar assembly contained two types of antenna panels: C-band and X-band. C-band radar data were used to create near-global topographic maps of Earth called Digital Elevation Models (DEMs).
Data from the X-band radar was used to create slightly higher resolution DEMs but without the global coverage of the C-band radar. The two radar datasets were combined to create interferogramatic maps of scanned areas. SRTM measurements took place February 11-22, 2000 (https://www.earthdata.nasa.gov/sensors/srtm).

Software requirement(s):
- ArcGIS Pro 3.3.0
Download package here:
1. Load Watershed_Analysis_Makah project
Download and double click on the Watershed_Analysis_Makah.ppkx to open it. Save your project in a meaningful location.
2. Improving visualization of the DEM
To enhance the visualization of your DEM, applying an effective symbology is essential. I like to use the Elevation #1 color scheme.
- In the Contents pane, right-click on the makah_dem.
- Select Symbology.

- In the Symbology window, click on the Color scheme's drop-down menu.
- Enable Show names and select Elevation #1.


This predefined color ramp provides a gradient from green to brown to white, representing varying elevations effectively. Green typically denotes lower elevations, transitioning to brown for mid-elevations, and white for the highest elevations. This color scheme not only makes it easier to distinguish different elevation levels visually but also highlights the natural terrain features, making them more intuitive to interpret.
Importance of consistent linear and vertical units in Watershed Analysis
Understanding and managing the linear and vertical units of your datasets is crucial for accurate watershed analysis. Linear units refer to the horizontal measurements, such as distances and areas, while vertical units refer to elevation measurements. Some datasets may use meters for linear units and feet for vertical units, or vice versa, which can lead to inconsistencies and errors in calculations if not properly managed. In our example, both the linear and vertical units are in meters, which simplifies the process and ensures consistency. This uniformity allows for straightforward slope and aspect calculations, as well as accurate hydrological modeling and other spatial analyses. Ensuring that both units match eliminates the need for unit conversion and minimizes the risk of errors, leading to more reliable and precise results in your terrain analysis.

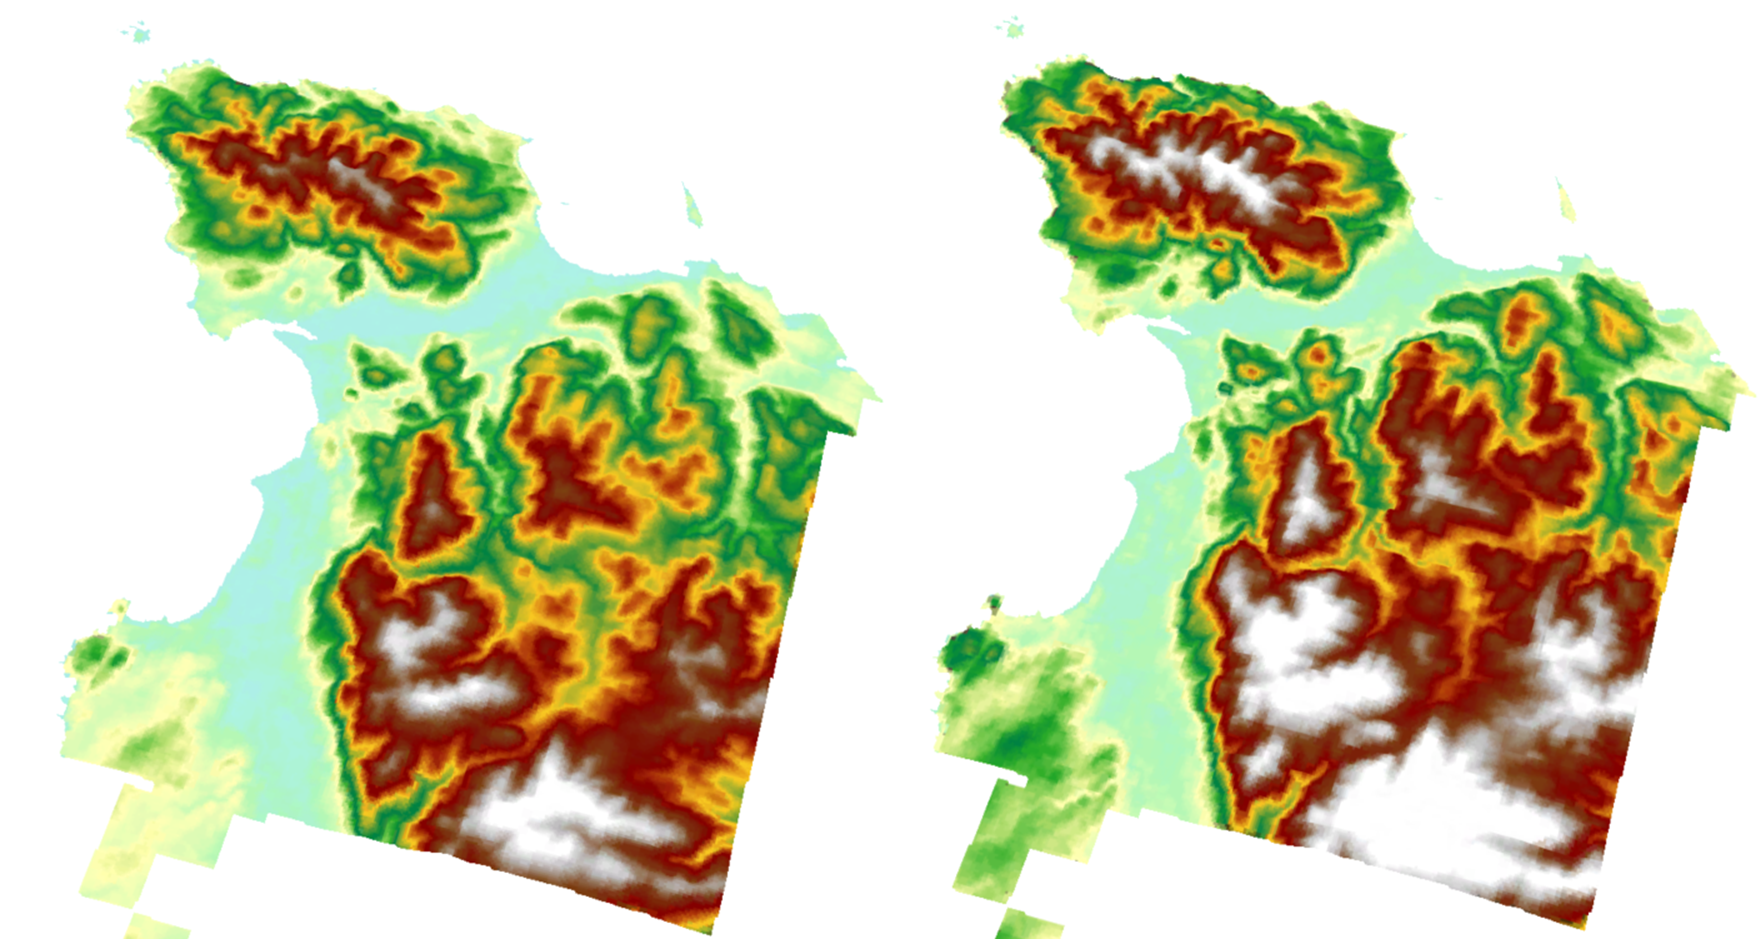
3. Fill Sinks
The Fill tool is used to fill sinks (depressions) in a DEM to ensure continuous flow paths for hydrological analysis.
- Go to the Analysis tab and click on Tools.
- In the Geoprocessing pane, search for Fill.
- Select the Fill tool.
- For Input Surface Raster select makah_dem.
- For Output Surface raster write DEM_Fill.
- Set the Z limit: 3 (feel free to try different values).
The Z limit parameter sets a threshold for the maximum elevation difference (in vertical units) that the tool will consider when filing depressions. Sinks deeper than this threshold will not be filled. This value should be chosen based on the specific characteristics of your study area and the level of details required for your hydrological analysis.
Consider Elevation Differences
Since our area of interest (AOI) includes elevations from - 13 to 597 meters, we need to choose a Z limit that is small enough to fill minor depressions without altering natural features significantly.
Focus on Critical Elevations
Part of the Makah Nation is at sea level (SL) and one of the main roads that crosses the nation from one coast to the other (Makah Passage Road) is barely above SL. Given the flooding risk for areas between 0 to 3 meters in the Coast Salish Sea (from SL rise and flooding), we need to ensure that the Z limit is set to fill small sinks that could impact flood modeling without modifying larger depressions that represent actual terrain.
Typical Z Limit Range
For a detailed analysis, a Z limit between 1 to 5 meters is often appropriate, ensuring minor sinks are filled while preserving significant topographic features.
If a Z-limit is not specified, all sinks are filled, regardless of depth.
- Click Run to create a depression less DEM.

- Change the symbology to #1 Elevation.
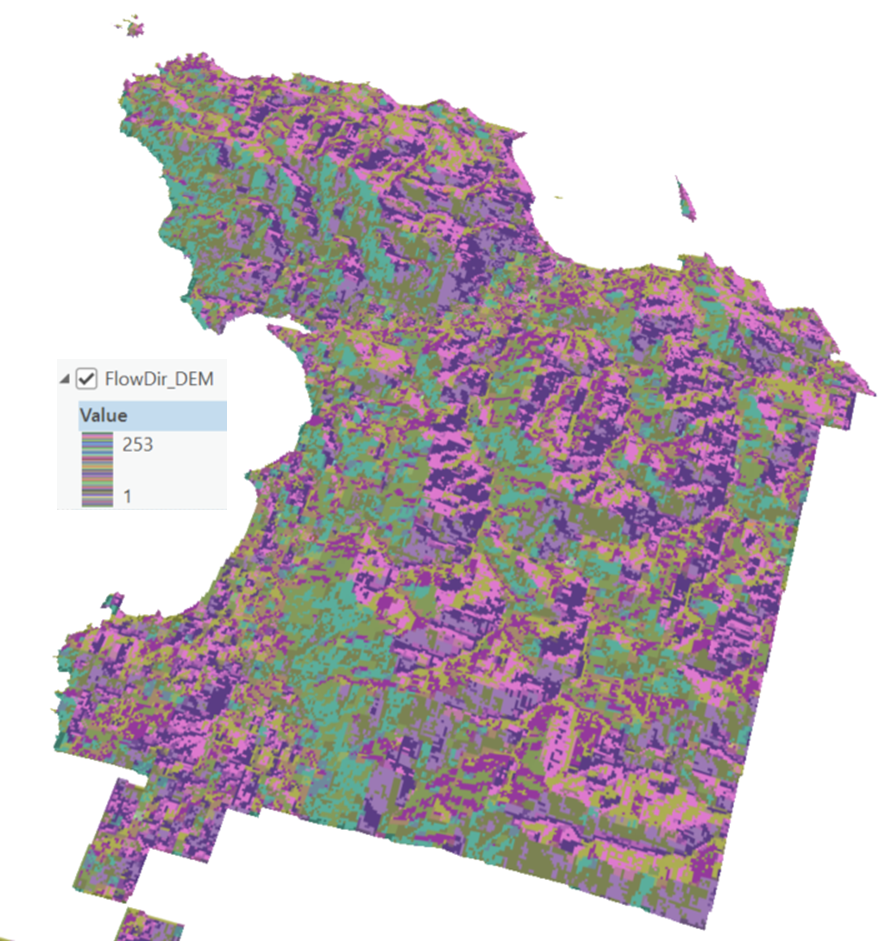
4. Flow Direction
Flow direction is used to determine the direction water will flow across a landscape. It involves analysis the DEM to assign a flow direction to each cell, indicating the steepest descent path. By calculating flow direction, we can understand how water moves through the terrain, identify drainage patterns, and predict potential areas of water accumulation or runoff.
Accurate flow direction analysis helps in designing stormwater management systems, assessing the impact of land use changes on hydrology, and planning interventions to mitigate flood risks.
- Go to the Analysis tab and click on Tools.
- In the Geoprocessing pane, search for Flow Direction.
- Select the Flow Direction tool.
- For Input Surface Raster select DEM_Fill.
- For Output Surface raster write FlowDir_DEM.
- The option Force all cells on the edge of the DEM to flow outward, prevents internal sinks at the edges and ensures continuous flow paths off the DEM.
Enable this option to avoid artificial sinks at the edges of your DEM, especially if your AOI is near the DEM boundaries.
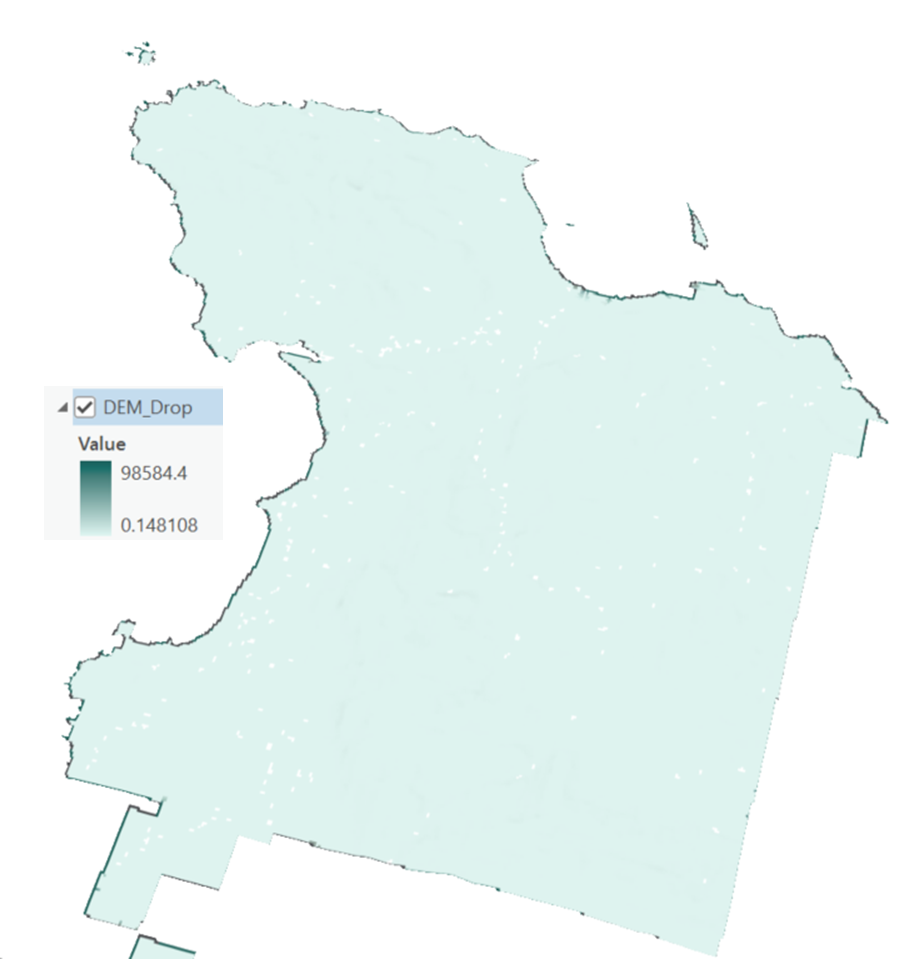
- Output Drop Raster. This option represents the drop elevation from each cell to its steepest downslope neighbor, useful for further analysis of erosion or runoff.
Generate this raster if you need detailed information on elevation changes, which can be helpful for understanding potential erosion or runoff rates.
- Flow Direction Type.
D8 (Deterministic 8): Assigns flow direction to one of the eight neighboring cells (N, NE, E, SE, S, SW, W, NW) based on the steepest descent. This option is best for simple and straightforward flow direction modeling, typically used for smaller or less complex areas.
MFD (Multi Flow Direction): Allows flow to be partitioned between multiple downslope neighbors, providing a more nuanced representation of flow direction. This option is best for areas with complex terrain where water flow diverges in multiple directions.
DINF (Deterministic Infinity): Uses an algorithm to distribute flow direction based on an infinite number of potential flow directions, providing a highly detailed and accurate flow representation. This option is best for detailed hydrological studies and areas with highly complex terrain.
- Click Run to generate the flow direction raster.

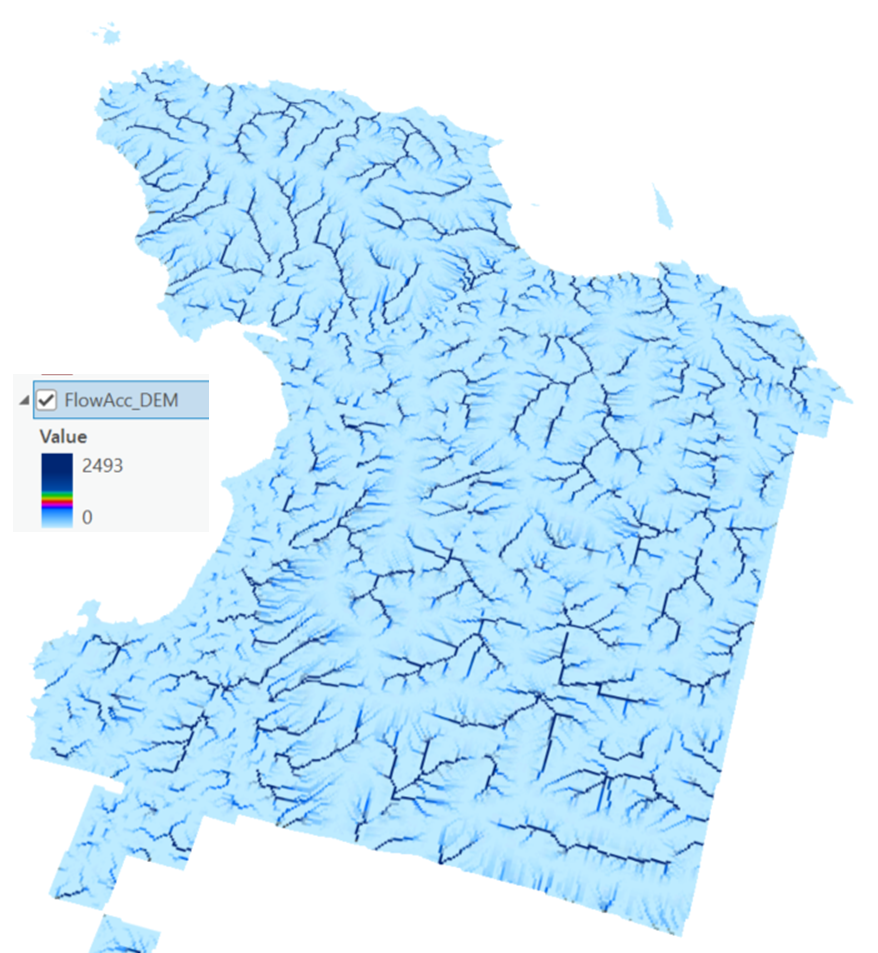
5. Flow Accumulation
Flow accumulation represents the accumulation of surface runoff in a landscape. It calculates the number of upstream cells that contribute flow to each cell in a DEM, effectively mapping out potential pathways of water movement across the terrain.
High flow accumulation values indicate areas where water is likely to concentrate, forming streams, rivers, or potential flood zones, while low values identify areas of minimal flow. Essential tool for understanding drainage patterns, managing water resources, and assessing flood risks.
- Go to the Analysis tab and click on Tools.
- In the Geoprocessing pane, search for Flow Accumulation.
- Select the Flow Accumulation tool.
- For Input Flow Direction Raster select FlowDir_DEM.
- For Output Accumulation raster write FlowAcc_DEM.
- Input Weight Raster: Optional, use if you have specific weights.
The input weight raster allows for a more refined and context-specific hydrological analysis. It contains values assigned to each cell that serve as multipliers or modifiers in the flow accumulation calculation. These values can represent various attributes or conditions that affect hydrological processes:
Precipitation Intensity
This raster can represent the spatial variability in rainfall. Cells with higher values indicate areas receiving more precipitation, contributing more significantly to flow accumulation. Helps in scenarios where rainfall is not uniform across the study area, allowing for more accurate modeling of water flow and accumulation based on varying precipitation levels.
Land Cover Type
Different land cover types (e.g., forest, urban areas, agriculture) can be assigned different values based on their infiltration and runoff characteristics. Useful in understanding how different land covers affect runoff and flow accumulation. For example, urban areas might have higher values due to low infiltration rates, while forests might have lower values.
Soil Permeability
Represents the capacity of soil to absorb water. Cells with higher values indicate more permeable soils, which might reduce surface runoff and increase groundwater recharge. Critical for studies focusing on groundwater recharge, soil erosion, or areas with varying soil types affecting water flow.
Impervious Surfaces
Identifies areas with impervious surfaces such as roads and buildings that prevent water infiltration, increasing surface runoff. Important for urban hydrology studies to assess the impact of urbanization on runoff patterns and potential flooding.
Vegetation Density
Represents the density of vegetation cover, which can affect evapotranspiration and water retention. Helps in ecological and environmental studies by considering the role of vegetation in modifying water flow and accumulation.
How to Use the Input Weight Raster
- Create or obtain a raster dataset that represents the attribute you want to incorporate into the flow accumulation calculation.
- Ensure that the raster aligns spatially with your DEM and has the same cell size and extent.
- Set the Weight Raster in the Flow Accumulation Tool
- In the Input Weight Raster parameter, select your prepared weight raster.
- Run the Flow Accumulation tool with the weight raster included. The flow accumulation values will be adjusted based on the weights, providing a more nuanced and accurate representation of water flow influenced by the specified attribute.
Example Use Case
Scenario: You are studying the impact of different land cover types on water accumulation in a watershed.
- Weight Raster: A raster representing different land cover types with values assigned based on their runoff potential (e.g., forest = 0.3, urban = 1.5, agriculture = 1.0).
- Flow Accumulation Calculation: The flow accumulation tool will use these weights to adjust the accumulation values, reflecting the influence of land cover on water flow. This allows for more accurate modeling of runoff and identification of areas at risk for flooding or erosion.
- Output Data Type: Float (for sufficient precision).
- Input Flow Direction Type: Match the type used in the flow direction raster, D8
- Click Run to generate the flow accumulation raster.

6. Watershed Delineation
Delineating watersheds involves using DEMs to analyze the terrain and determine the flow paths of water across the landscape, ultimately defining the catchment areas that contribute water to specific points.
Importance of Watershed Delineation
Water Resource Management
- Efficient Allocation: Watershed delineation helps in understanding the distribution and flow of water resources, enabling efficient allocation and management. It is crucial for ensuring sustainable water supply for agriculture, industry, and domestic use.
- Flood Management: By identifying watershed boundaries, planners can predict areas susceptible to flooding and design effective flood control measures, such as retention basins and levees.
Wildfire Management
- Fire Behavior Prediction
- Water Availability: Watershed delineation helps identify areas with natural water sources, such as streams and rivers, which can serve as natural firebreaks or sources for firefighting water supplies.
- Vegetation and Fuel Mapping: By delineating watersheds, managers can better understand the distribution of vegetation types and fuel loads within different parts of the watershed, aiding in the prediction of fire behavior and spread.
2. Firefighting and Mitigation Strategies
- Strategic Planning: Knowing watershed boundaries helps in planning strategic firebreaks and deploying firefighting resources more effectively. Natural barriers identified through watershed delineation can be used to control and contain wildfires.
- Water Access Points: Watershed maps provide critical information on the best locations for accessing water for firefighting efforts, ensuring that resources are used efficiently during wildfire events.
- Post-Fire Recovery and Erosion Control
- Erosion and Sediment Control: After a wildfire, watersheds are at increased risk of erosion and sedimentation due to the loss of vegetation. Delineating watersheds helps in identifying areas most vulnerable to erosion and implementing erosion control measures such as check dams and re-vegetation.
- Water Quality Protection: Watershed delineation helps in planning efforts to protect water quality in streams and reservoirs by identifying critical areas for sediment control and reducing the risk of contamination from post-fire runoff.
- Flood Risk Assessment
- Increased Runoff: Wildfires often lead to increased runoff due to the loss of vegetation and soil structure. Watershed delineation helps predict changes in hydrology and assess the increased risk of flooding, enabling proactive flood management measures.
- Flood Control Infrastructure: Understanding watershed boundaries is essential for designing and implementing flood control infrastructure such as retention basins and diversion channels to manage post-fire runoff effectively.
5. Habitat and Ecosystem Restoration
- Ecosystem Recovery: Watershed delineation provides a framework for ecosystem restoration efforts by identifying areas critical for water flow and habitat connectivity. Post-fire recovery plans can be tailored to enhance natural regeneration and protect aquatic habitats.
- Biodiversity Protection: By understanding the interconnectedness of different parts of the watershed, restoration efforts can be prioritized to protect and restore biodiversity hotspots impacted by wildfires.
Environmental Protection
- Pollution Control: Watershed delineation aids in identifying sources of pollution and their impact on water bodies. It helps in implementing targeted pollution control strategies and maintaining water quality standards.
- Ecosystem Preservation: Understanding watershed boundaries is vital for preserving aquatic and terrestrial ecosystems. It helps in managing habitats and protecting biodiversity by maintaining the natural flow regimes.
Urban and Infrastructure Planning
- Stormwater Management: Delineating watersheds is essential for designing stormwater management systems. It ensures that urban development projects consider natural drainage patterns, reducing the risk of flooding and erosion.
- Infrastructure Development: Knowledge of watershed boundaries aids in planning infrastructure projects, such as roads and bridges, by accounting for hydrological impacts and minimizing environmental disruption.
Agricultural Planning
Irrigation Design: Watershed delineation informs the design of irrigation systems, ensuring that water resources are used efficiently to support agricultural productivity.
Soil Conservation: Identifying watershed boundaries helps in implementing soil conservation practices, such as contour farming and terracing, which reduce erosion and maintain soil health.
Hydrological Modeling
Flow Prediction: Watershed delineation is fundamental for hydrological modeling, which predicts the flow of water through the landscape. This is essential for assessing the impact of land use changes and climate variability on water resources.
Watershed Management Plans: Accurate delineation forms the basis for developing comprehensive watershed management plans, integrating various aspects of water resource management, environmental protection, and land use planning.
a) Creating and Finding Pour Points for Watershed Delineation
Pour points, also known as outlet points, are specific locations where water flows out of an area, such as the mouth of a river or the outlet of a basin. Identifying and creating accurate pour points is essential for delineating watersheds.
- Identify Potential Pour Points
• Flow Accumulation Raster: Use the flow accumulation raster to identify potential pour points. High values in the flow accumulation raster indicate areas where water collects, which are likely candidates for pour points.
• Stream Network: If available, use an existing stream network or drainage layer to help locate significant stream junctions and outlets.
- Create Pour Points Manually
Interactive Placement: Add a basemap and the flow accumulation raster to your map to provide context.
Create a Point Feature Class:
- In the Catalog pane, right-click on your geodatabase, select New, and then Feature Class.
- Choose Point as the geometry type and name your feature class (e.g., PourPoints).
Start Editing:
- Go to the Edit tab and select Create.
- Choose your new point feature class (e.g., PourPoint1).
- Use the flow accumulation raster to guide the placement of points at key locations with high flow accumulation values (e.g., at the mouth of rivers or major drainage outlets).
- Click on the map to place the pour points.
- Save your edits and your project.
- Snap Pour Point Tool (Snap Pour Points to High Flow Accumulation Cells)
Use the Snap Pour Point tool to adjust the location of pour points to the nearest cell with high flow accumulation. This ensures that the pour points are accurately positioned to reflect true watershed outlets.
- Go to the Analysis tab and click on Tools.
- In the Geoprocessing pane, search for Snap Pour Point.
- Select the Snap Pour Point tool.
- Input Points: Select your manually created pour points feature class (e.g., PourPoint_Makah1).
- Input Accumulation Raster: Select your flow accumulation raster (e.g., FlowAcc_DEM).
- Snap Distance: Set an appropriate snap distance based on your DEM resolution.
- Output Snapped Points: Specify the output feature class (e.g., SnapPP1).

- Run the tool to adjust the pour points to the nearest high flow accumulation cells.
Creating and finding pour points involves identifying key locations where water exits the watershed using flow accumulation rasters and stream networks. By manually placing pour points and snapping them to high flow accumulation cells, you ensure accurate and reliable watershed delineation. This process is essential for effective hydrological modeling and water resource management.
b) Watershed Delineation and Analysis
- Go to the Analysis tab and click on Tools.
- In the Geoprocessing pane, search for Watershed.
- Select the Watershed tool.
- For Input Flow Direction Raster select FlowDir_DEM.
- For raster or feature point data select PourPoints_Makah1.

- Specify the output location and click Run.

Repeat the steps for each Pour Point to generate various watersheds if needed.
Visualize Watersheds
- The watershed layer will be added to your project.
- Use symbology to differentiate between watersheds.
Analyze Watersheds
Examine the watersheds to understand drainage patterns and potential flood areas.
We hope that this article has been helpful! If you have any feedback or questions, please feel free to send us an email or connect with us for a chat. The NTGISC team is here to assist you further!
Resource (s):
https://pro.arcgis.com/en/pro-app/latest/tool-reference/spatial-analyst/snap-pour-point.htm